eye square – Visual Measurement is the first pre-test solution that tracks the users’ visual perception through eye tracking in at home natural media usage.
eye square – Visual Measurement allows panel users to browse and use media just as they normally would, while controlling ad campaigns in the planned media context. The software measures the respondents’ visual engagement with ads and content through eye tracking and emotion recognition and produces easy to use performance reports.
eye square – Visual Measurement is applicable for traditional channels, digital desktop and mobile campaigns. It controls campaigns and the media context by using a browser based media player on the PC (or Smart TV), a browser extension on digital desktop and an app on mobile devices.
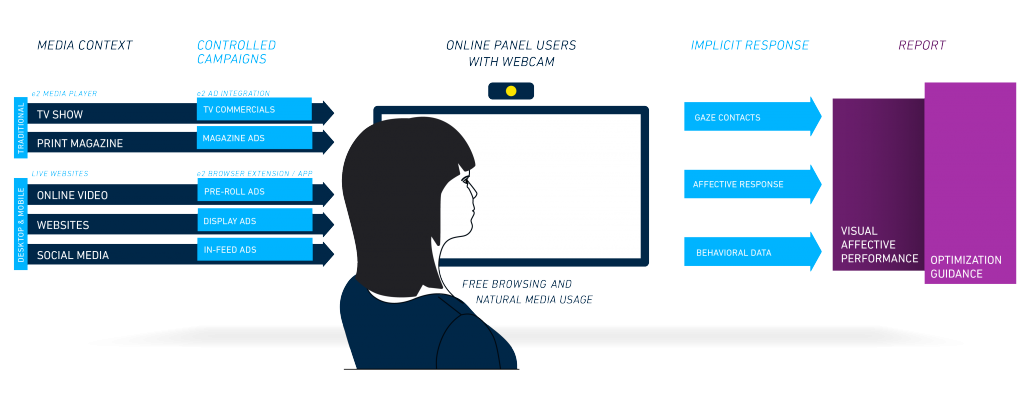
Measure before the fact and shift budgets
eye square – Visual Measurement allows advertisers and agencies to measure their branding performance before and during their campaigns, allowing them to shift budgets to creatives, placements, and audiences that are achieving high visual & affective performance.
![]()
learn, repeat and scale
eye square’s norms database helps clients to understand how competitive their brand communications are and provides insights on how different forms of visual engagement drive ad effectiveness. It allows our clients to quickly identify successful marketing concepts and then to repeat and scale them.
![]()
understand what and how to improve
eye square’s Visual Measurement scorecards indicate what elements of an ad are not working and provides guidance on how to improve them. Based on the objectives of a campaign, the scorecard metrics serve as measurable objectives in creative briefings and strategic campaign planning.
![]()
EYE SQUARE – VISUAL MEASUREMENT helps advertisers and agencies to monitor, plan and create successful advertising.
Consumers perceive media with a narrow spotlight of attention that is as effective in filtering a media experience as it is revealing about the viewers interests and their visual and affective involvement in media and ads. A fact that may fundamentally transform how brand marketing is measured, planned and designed.
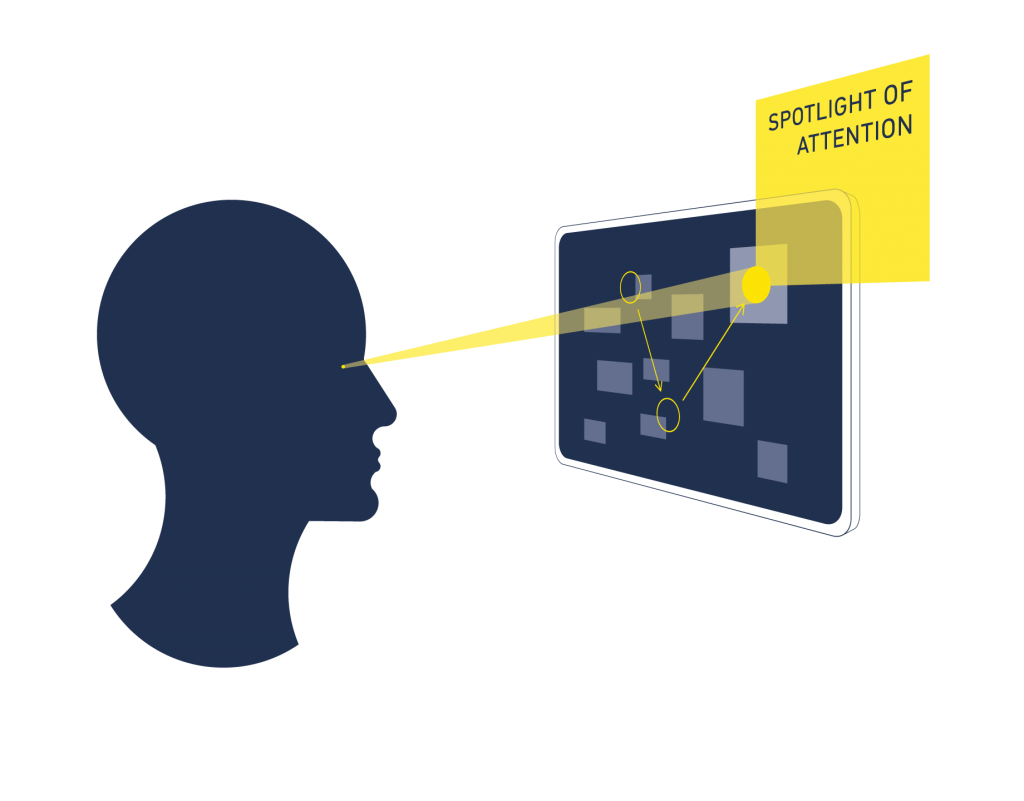
The spotlight of attention filters the abundance of media content. It creates a highly subjective media experience.
Attention is a precondition for the success of any marketing communication. Yet attention is becoming an increasingly scarce resource. In response to a media environment with rapidly increasing visual content, consumers have adopted a faster, more versatile and highly selective viewing behavior which poses new challenges to marketers when trying to connect with their target audience. These new viewing habits are characterized by
Consumers are now managing their visual choice on bigger and higher resolution displays that allow them to scan and selectively involve in some content while overlooking or suppressing attention to other areas of the screen. A highly effective yet paradoxical psychological process that is known as selective attention.
Selective attention should be considered the decisive test that any brand message has to comply to.
Contrary to our self perception that our eyes can objectively oversee a continuous visual scene, our visual perception is based on brief serial intakes at very narrow points of sharp vision (only about 2 centimeters wide on a media display at 1 meter distance). This narrow spotlight of attention is guided by voluntary and involuntary impulses that consider the relevance and appeal of the presented media as well as our expectations and prior experiences. Our brain supplements this limited input with information it expects in a given context.
Selective visual attention works as a subjective and context related filter that we apply to our media experiences. In a highly competitive media context it should be considered the decisive test that any brand presentation has to comply with.
The precise fixations of the consumers eyes are as effective in filtering a media experience as they are in revealing the viewers interests and their cognitive and emotional involvement in media and ads. By tracking the eye movements and corresponding facial expressions of participating viewers, marketers and agencies can measure three levels of attention and engagement:
ATTRACT
Attract level metrics measure the strength of the impulse to look at an ad. Attract metrics are used to find designs and layouts, key-visuals, formats and placements that draw the initial attention of an audience, and to identify creatives and placements that viewers are avoiding.
ENGAGE
Engage level metrics measure the quality of the main ad element (key visual) to maintain the viewers attention, elicit positive emotions and advance attention to further ad content. Engage metrics are used to find key visuals that appeal to and engage viewers.
INTEREST
Interest measures the completeness of visual processing of the salient elements of the ad and indicates whether the viewer is actively exploring the ad for further product related information. Interest level metrics are used to gauge whether an ad is effective in communicating it’s complete message and what elements of the ad viewers are either focusing, scanning or skipping.

Driven by higher resolution cameras and advances in computer vision the process of visual selection and engagement is now firmly observable by tracking the gaze directions and facial muscle movements of participating consumers that grant access to their webcam or front facing camera of their media screen. The required software is unobtrusive and compliant with privacy standards
eye square – Visual Measurement records a participants attention on websites by using standard webcams of PCs and laptops. The solution does not record or transmit video, imagery or personally identifiable data of the user. It instead measures and transmits gaze directions and affective responses to specifically targeted media.



In Context tests of TV and Print campaigns
eye square – Visual Measurement can track up to 60 minutes of TV or Print media usage on the user’s PC or laptop. A media player allows the user to pick preferred content and to browse and switch channels freely.
Cross Media Tests
eye square – Visual Measurement can link traditional media and digital campaign tests. The solution facilitates cross media research through an analysis model that consistently applies to TV, Print, Online Video and Online Display advertisements.
Campaign Pretesting on Live Websites
eye square – Visual Measurement allows our clients to simulate & test full digital ad campaigns with support for video and rich media formats. The solution enables campaign pre-testing, benchmarking and strategic campaign planning on live websites not owned by the client.
Free Browsing
The solution allows users to pick their preferred websites and media and use them as they normally would. Live media in context tests are enabled by the systems long term tracking and conditional ad simulation capabilities.
eye square – Visual Measurement works with standard webcams and easily integrates into online surveys or user panels via a browser extension or mobile app.
The solution uses gaze accuracy validation that ensures high data quality. It allows individual gaze replays and access to raw data in a fully transparent analysis model.
The solution does not record or transmit video, imagery or personally identifiable data of the user. It instead measures and transmits gaze directions and affective responses to specifically targeted media.
The eye square – Visual Measurement scorecard is a standardized report of the key performance metrics of an ad presentation.
The Visual Measurement scorecard consists of three diagrams, that aim to answer the following questions:
Below is an example of a Visual Measurement scorecard and a description of each diagram.
Scorecard example
How does the ad work?
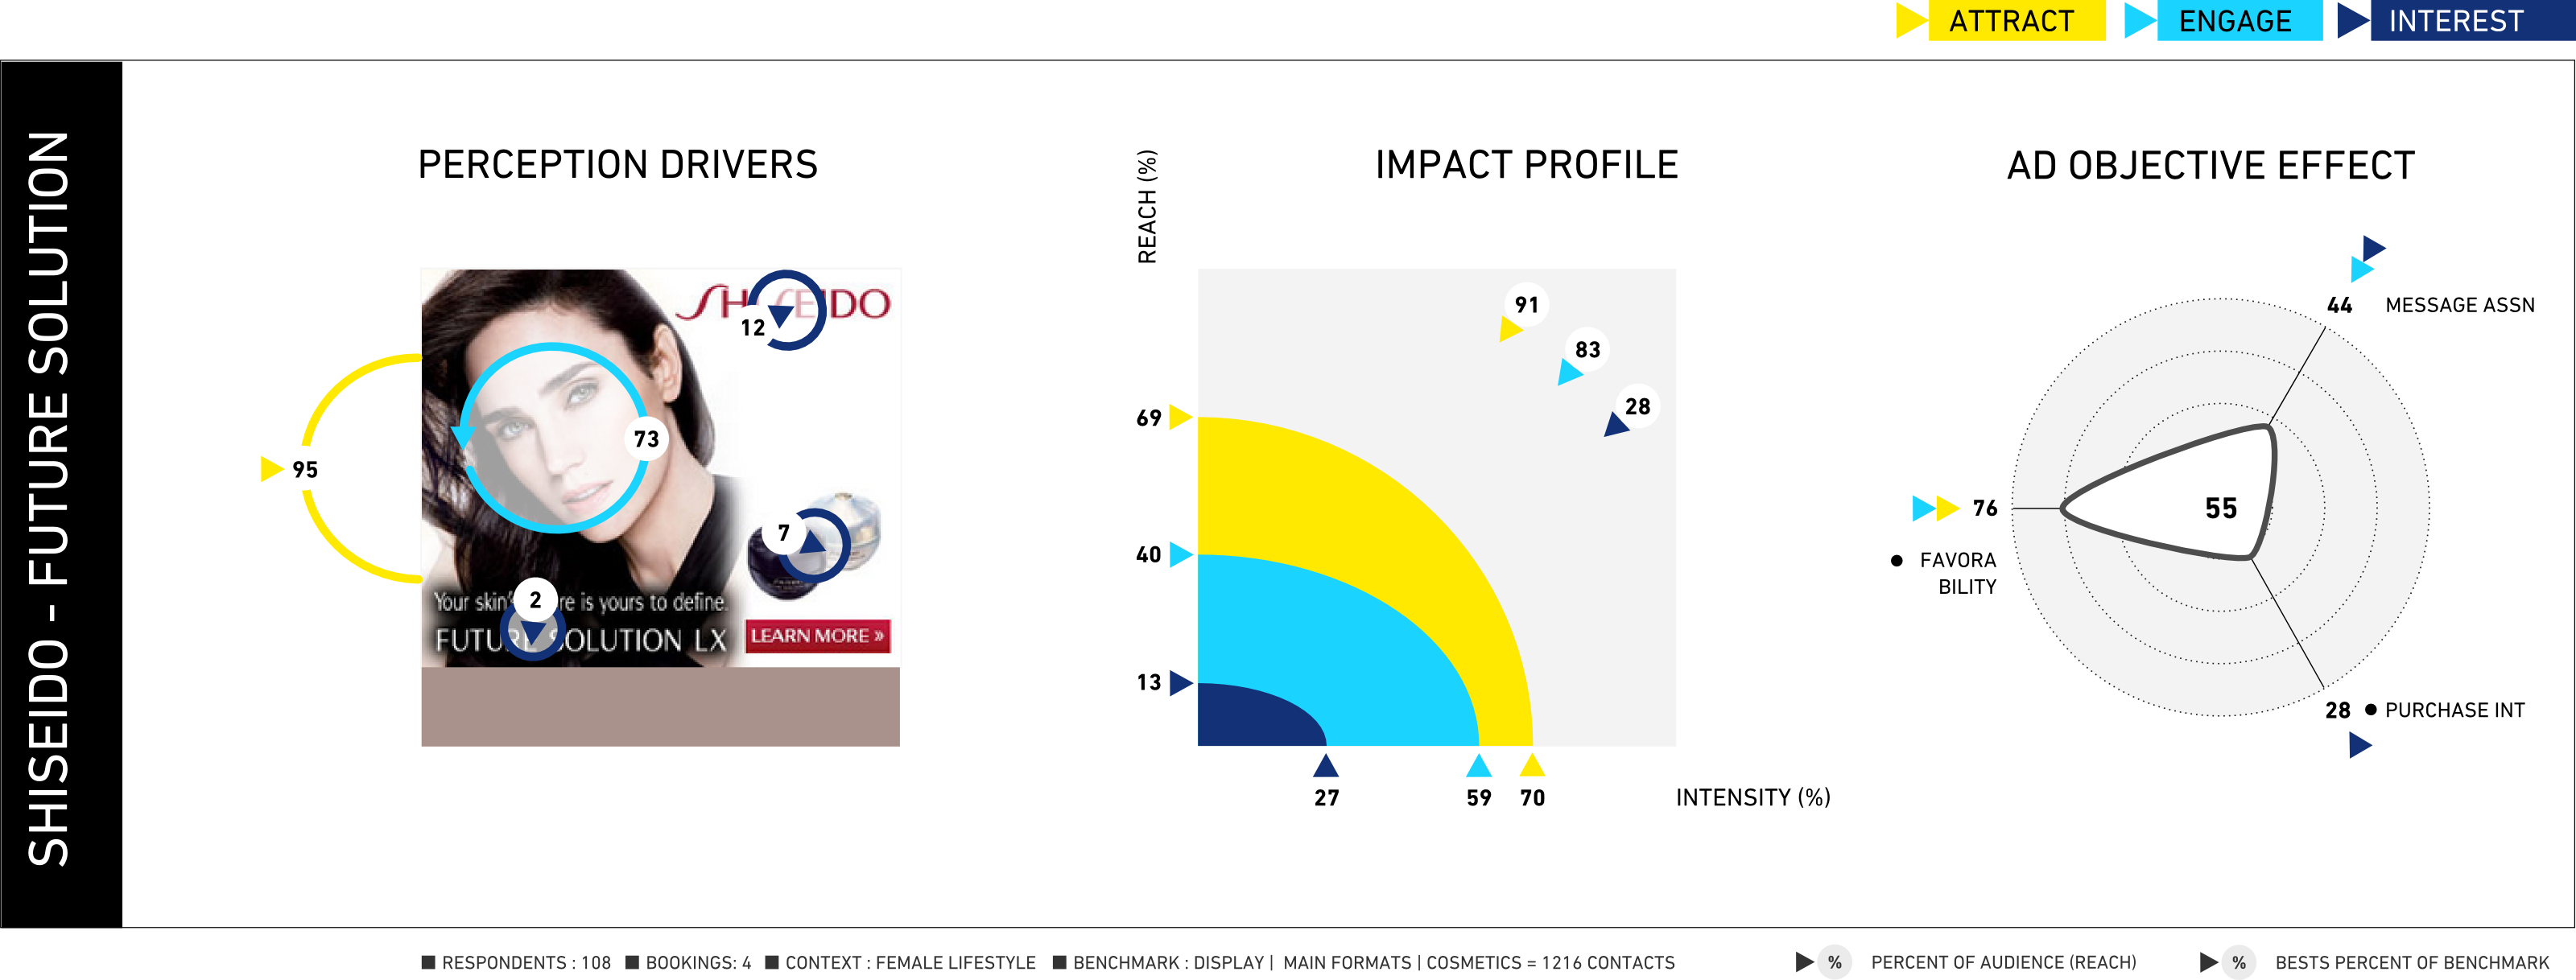
This diagram is a visualization of how the ad’s individual elements are perceived. It shows what features of the ad are driving it’s perception and which ones are not performing as expected. Understanding how and why the ad works, allows creative designers to implement selective changes to improve it.
How much engagement does the ad produce?
This diagram is a visualization of the three visual engagement levels (Attract, Engage, Interest) that have been measured. Bigger sized circles visualize higher engagement on the respective engagement level. The display allows advertisers to see where in the contact funnel viewers are engaging or leaving the communication. The visualization can be seen as the “engagement footprint” that the ad generates per thousand impressions (CPM). It is used to focus creative design and campaign planning on maximizing suitable engagement levels per spend.
What effect does the ad have on the ad objective?
This diagram shows how well the measured visual engagement corresponds with the ad objective that the ad is supposed to achieve. It shows the predicted effect on lifting the ad objectives of favorability, message association and purchase intent.
The Ad Objective Effect diagram in the example above indicates that the ad is effective in driving favorability (76% effective). Still the ad is less successful in communicating the specific product message (44%) and not successful to directly effect purchase intent (28%)
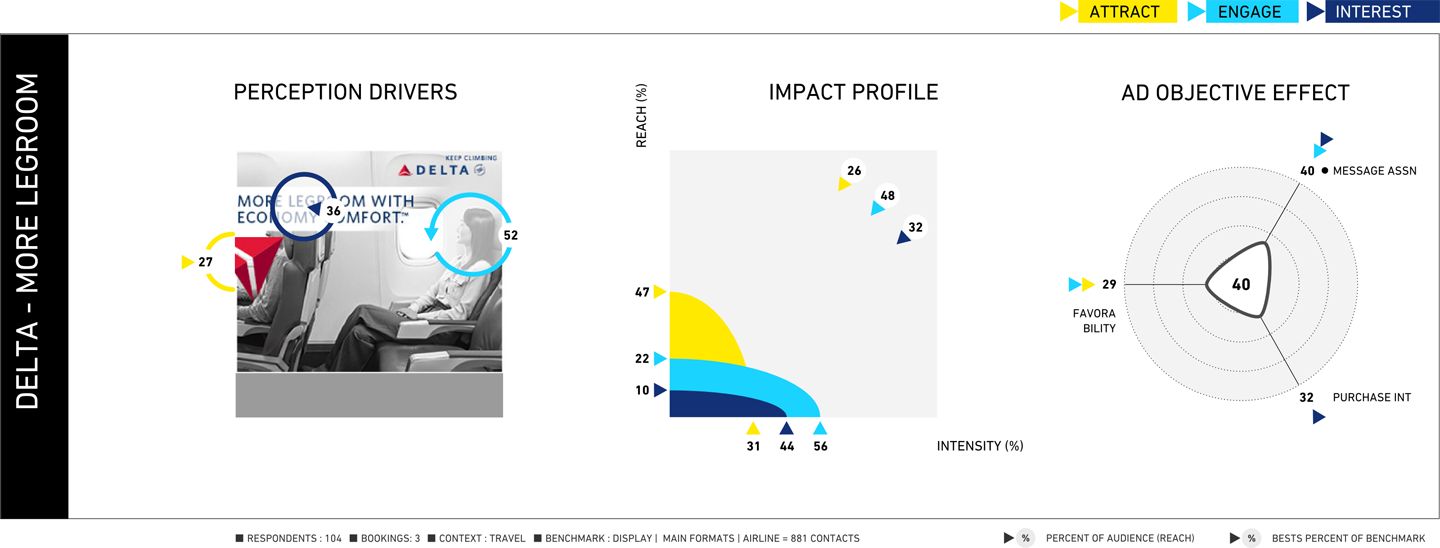
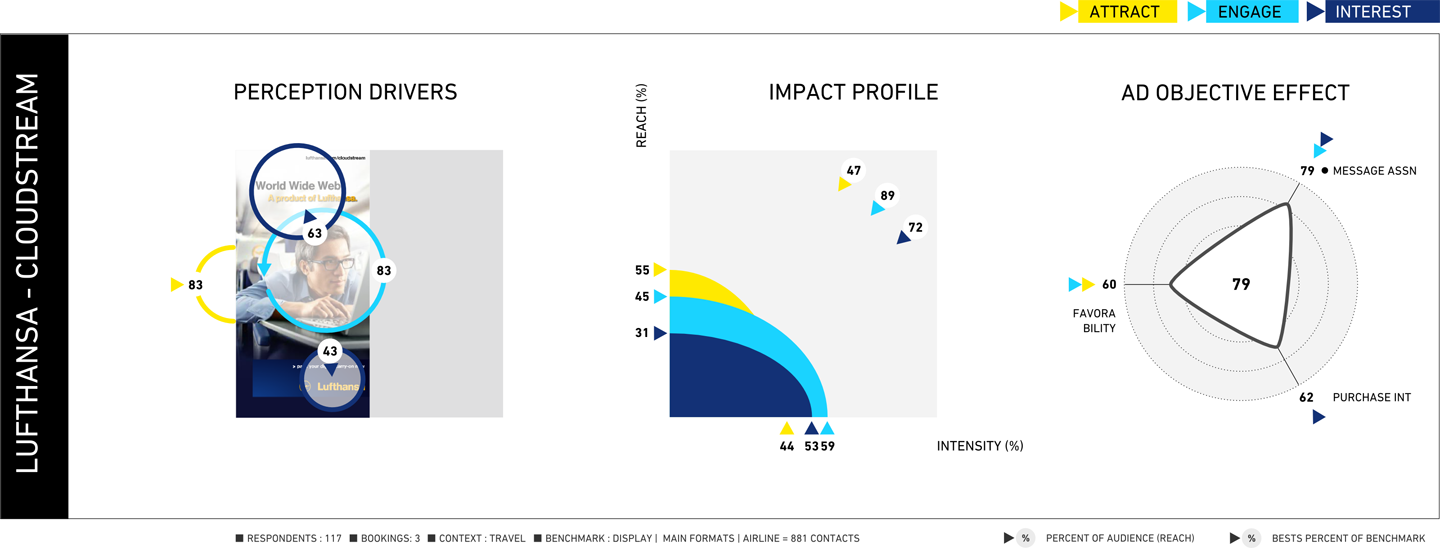
In the examples below two airlines aim to communicate a specific feature of their product.
The analysis indicates that only 10% of Delta’s audience have processed the ad content to absorb the message of the ad (“Delta has more legroom”), while 31% of Lufthansa’s audience have shown interest in the complete ad content. Further analysis shows that the key visual of the Delta ad is failing to engage the viewers in the subject of the ad.
Scorecards – Creative Optimisation
The following example evaluates the performance of booking a cosmetics ad (Covergirl – Jumbo Gloss) on the female fashion & lifestyle website louloumagazine.com.
The ad manages to involve only 16% of the sites visitors in the features of the advertised product but it achieves high engagement to it’s key visual and an above average predicted effect in lifting favorability. The face draws in the viewer, but they don’t read the message.
Scorecard – Booking Performance

The second scorecard shows aggregated data of 12 cosmetics ads tested in the louloumagazine.com context. The analysis shows that the louloumagazine.com context lifts favorability of cosmetic brands better than 79% of other lifestyle contexts. The website also performs well on the predicted message association dimension.
Scorecard – Media Planning

An explanation of the comparably poor performance of the Covergirl creative booking in the louloumagazine.com context is that the design and layout of the creative does not fit into the general style of the website and is thus disregarded by the viewers of louloumagazine.com.

You need to load content from Turnstile to submit the form. Please note that doing so will share data with third-party providers.
More Information